Theory · For the skeptic
How Much to Trust the Model
What the accuracy of a model of the field means in practice, how to read it on the screen, and where I would not rely on it yet.
The previous article, How the Model Is Tested, describes the method: held-out hands, four measurements, a version ships only if it improves. This one is about the practical question that follows from it. When the explorer shows a range and the exploit view shows a best response, how far can you lean on them?
Where this stands
This is a project in development. The models on the site are demonstrations: each is trained with the same recipe on the mined hand histories of its pool, and each is scored on hands it never saw. I keep changing the recipe, and every change is accepted or rejected on those same held-out hands. The explorer you see is the current state of that work, not a finished product with a fixed accuracy figure attached.
I do not publish the scores. They move with every version, and a number without its history and its scale says little to an outside reader. What I can give you is the shape of the answer: what is measured, what a typical result looks like, and where the measurement itself tells you to be careful. To a partner who wants the numbers I show them in full, with the baselines beside them.
What accuracy means here
Two things are measured, and they answer different questions.
Frequencies. In a given spot, how often does the pool check, bet, raise, fold, and with which sizes? This is visible in every hand, so it can be checked everywhere. On the common lines of a game the model's frequencies sit within a few percentage points of the observed ones. On rarer lines the gap grows, simply because there is less to learn from.
Holdings. Given a line of actions, which hands took it? This can only be checked at showdown, where the cards are known. It is the harder question and the one the exploit depends on, because the best response to a range is only as good as the range. Here the honest statement is relative, not absolute: the model assigns the shown hand far more probability than a model that knows only the position and the preflop action, and the gap to a model that sees the cards is measured and shrinking with each version.
Neither number is a percentage of "correct" hands. A range is a distribution over all holdings, and the quality of a distribution is how much weight it puts on what actually happened, across thousands of showdowns. That is what the measurements score.
Expected error on the screen
The number that matters most for daily use is the one in the explorer itself. Every spot carries an expected error: the typical gap, in percentage points, between the frequencies the model predicts there and the ones the pool shows on hands the model never saw, with sampling noise removed. It is the frequency measurement above, carried down to the spot in front of you.
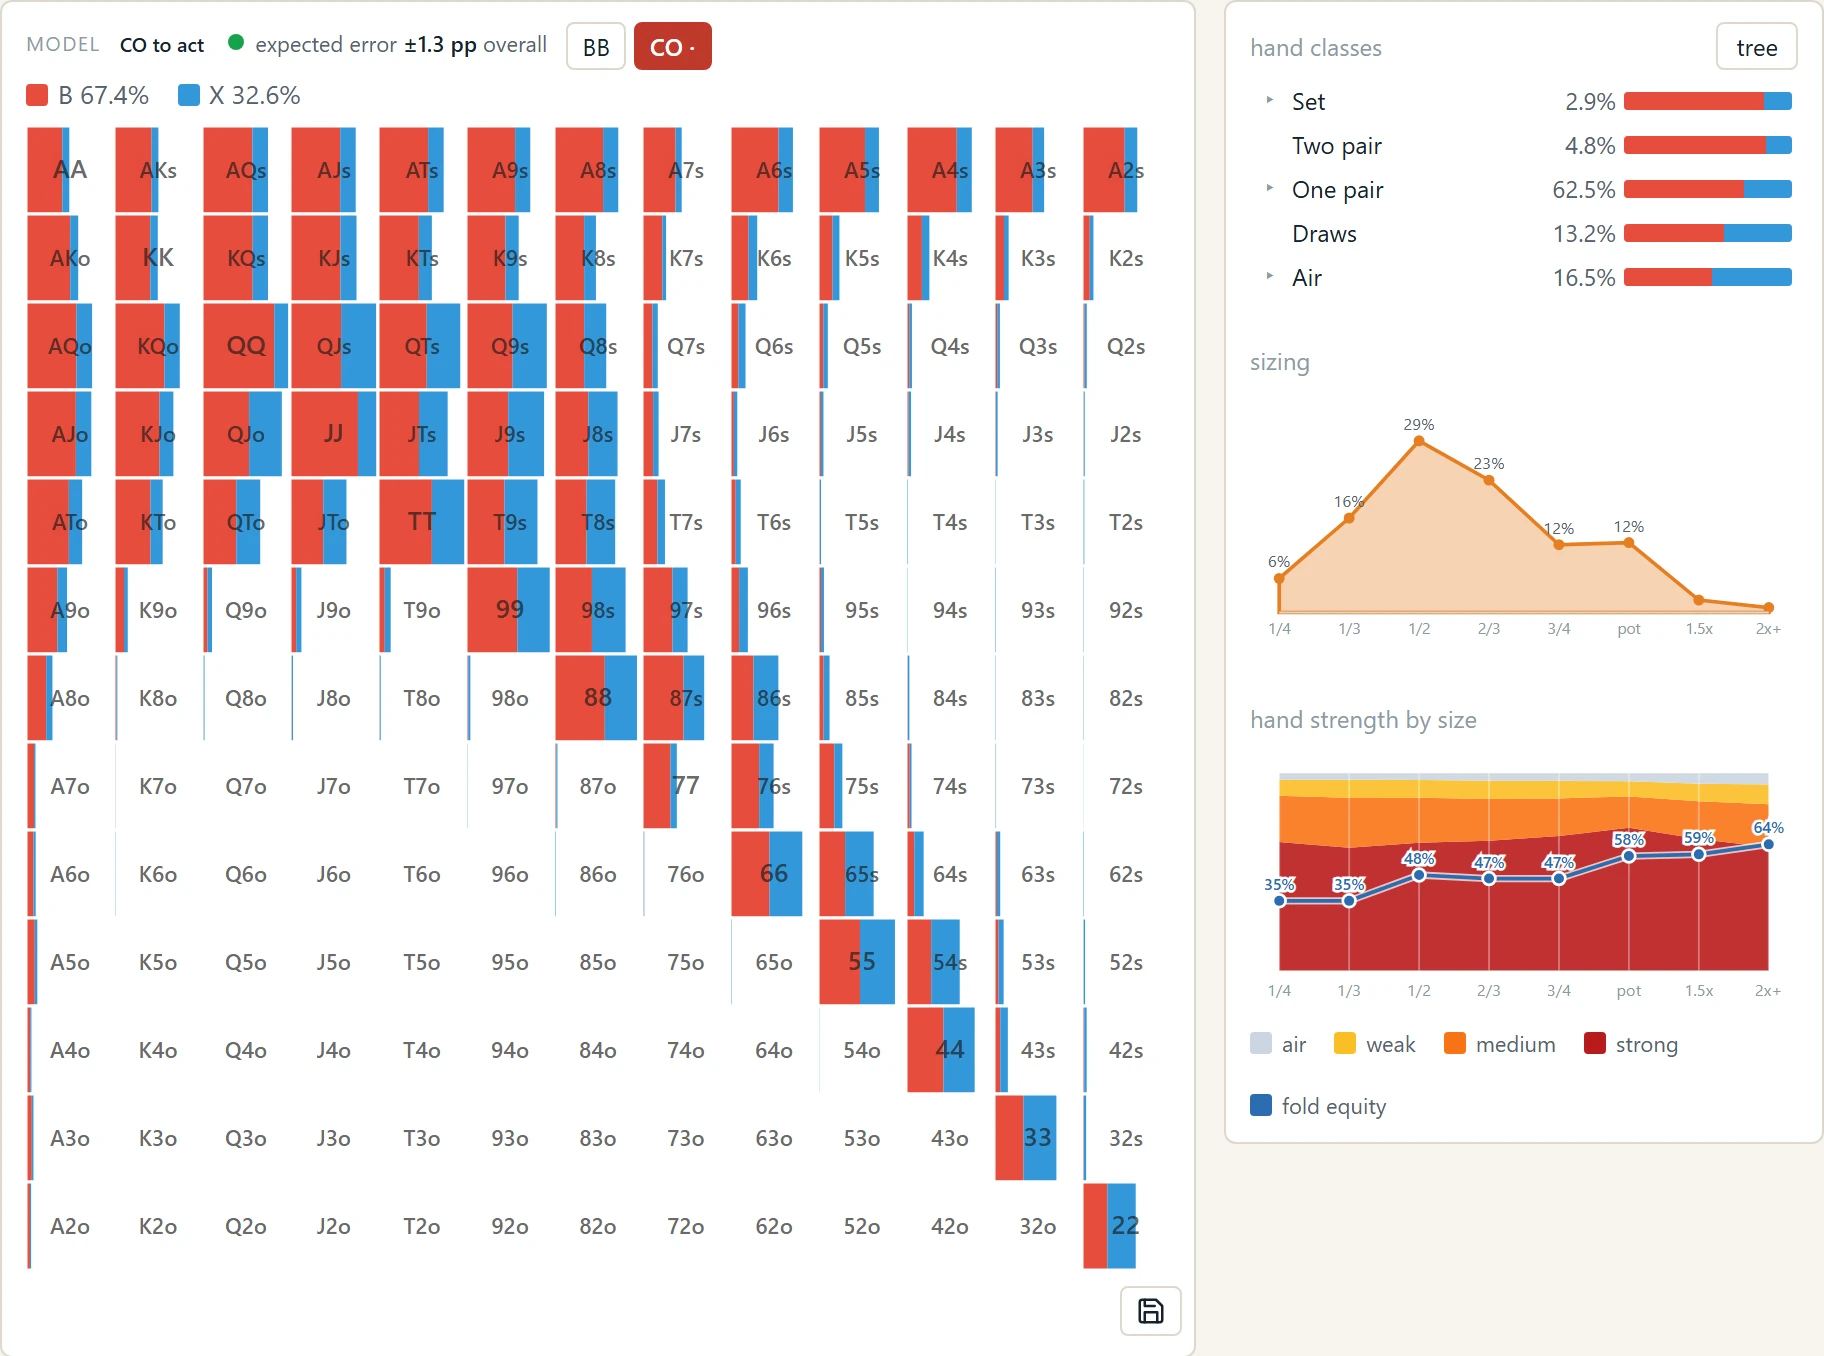
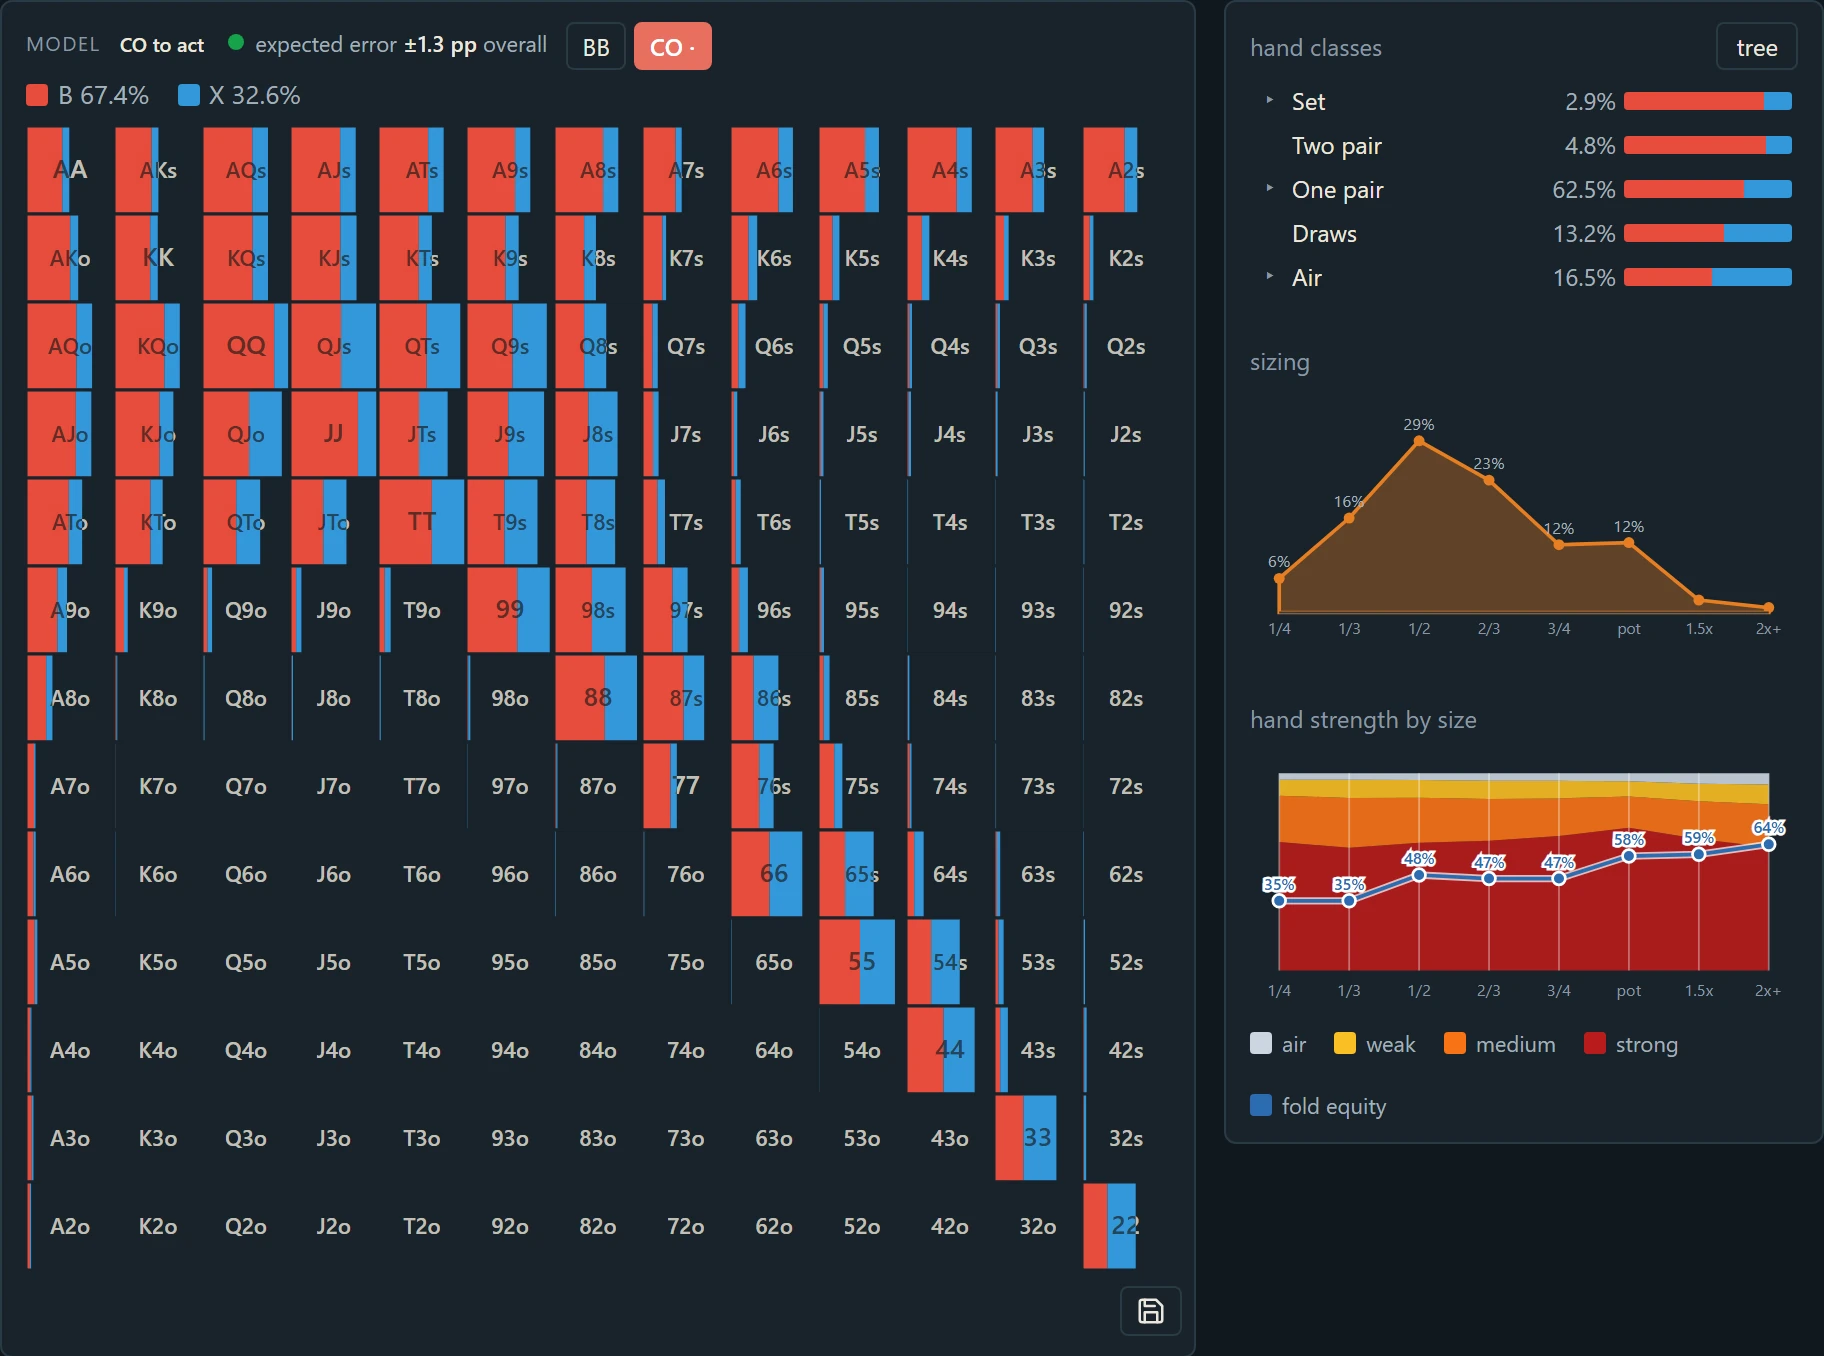
Read it as a confidence level for everything else on the screen. A green spot on a common line is where the model knows the pool well and the exploit is worth taking seriously. A red or rare spot is where the model is extrapolating. The ranges there are still the best estimate available, but the exploit against them is a best response to a guess, and it will happily find and use the guess's mistakes. That is the main risk of any exploit built on a model, and the expected error is the guard against it: where the number is large, do not act on a small EV difference between two options.
How much data is enough
My experience so far is that a database of two to three million hands of one game is enough to build a model whose exploit of the pool is practical: the common lines are covered, the best response is stable from version to version, and the simulated value of the exploit lines up with what strategies of that kind earn in the data.
What I have not tested is the lower threshold. I do not yet know how the accuracy degrades at one million hands, or at three hundred thousand, or where a model stops being useful. That is a planned experiment, not a known result, and until it is done I would not promise anything about smaller databases. Within a model, the expected error is the local answer to the same question: it shows where the data ran thin, spot by spot.
Where the model is weaker
Some of this follows from the data, some from the approximations I chose to keep the computation tractable.
- Rare lines. Four-bet pots, check-raise wars, lines the pool takes once in thousands of hands. The expected error says so on the screen.
- Deep stacks. Most of the data is at ordinary cash-game depths. The deeper the stack, the thinner the evidence for the late streets.
- Multiway pots. The model has ranges for them, but in the prototype the exploit is computed for two players; in a multiway spot you get the ranges and a report, not a best response. This is not a gap in the method: I have a technical solution for the multiway best response, and it is a matter of training cost, which is high and slow, so it is not in the prototype yet.
- The flop exploit. On the flop the best response has to look two streets ahead. To finish in reasonable time it uses an approximation for the turn and river; its cost is measured and kept small, but it is there.
- A different pool. Each model describes the pool it was built from. Nothing here says anything about another limit or another room.
What is not a measure of accuracy
Distance from a solver is not one. The model is meant to reproduce how a pool plays, and pools do not play equilibrium; a model that matched a solver would be a wrong model of the field. The comparison line in exploit view, the gap between playing the spot as the field and playing the best response, is not an accuracy figure either. It is the size of the opportunity in that spot, and it is only as reliable as the expected error next to it.