Theory · For the skeptic
How the Model Is Tested
A model of the field can look right and be wrong. Here is how we tell the difference, and why some checks matter more than others.
Any model of player behavior can be made to produce plausible-looking ranges. The interesting question is whether those ranges are true: whether the players in the pool really hold what the model says they hold, and really do what the model says they do. Answering that requires tests the model cannot pass by looking plausible.
Hands the model has never seen
Before training starts, a portion of the data is set aside and never touched. Every version of the model is scored on that same held-out set, so results are comparable from one version to the next. A second, independent held-out set is used to confirm that improvements are not an accident of the first one.
This is the ordinary discipline of predictive modeling, and it is the part most often skipped in poker analysis. A model that is scored on the data it was fitted to will always look good. The only score that means anything is the one on data it did not get to see.
Four questions, four measurements
On the held-out hands, the model is asked four things. Two of them measure the goal directly. Two are guardrails.
1. Does it predict what players do?
Take every public event in every hand: each player's action at each decision, and the cards that were shown at showdown. The model, given everything that was visible up to that point, assigns a probability to what happened next. We measure how much probability it gave to the actual event, across every event in the set.
The important property of this measurement is that it uses every hand, not only the ones that reached showdown. A player who folded on the flop still made a prediction-worthy decision, and the model is scored on it. Hands that end without showdown are handled by summing over every holding the player could have had, weighted by the model's own estimate. That is what keeps the measurement honest: it is not skewed toward the hands that happened to be shown, and it cannot be improved by tuning the model to look good on showdowns alone.
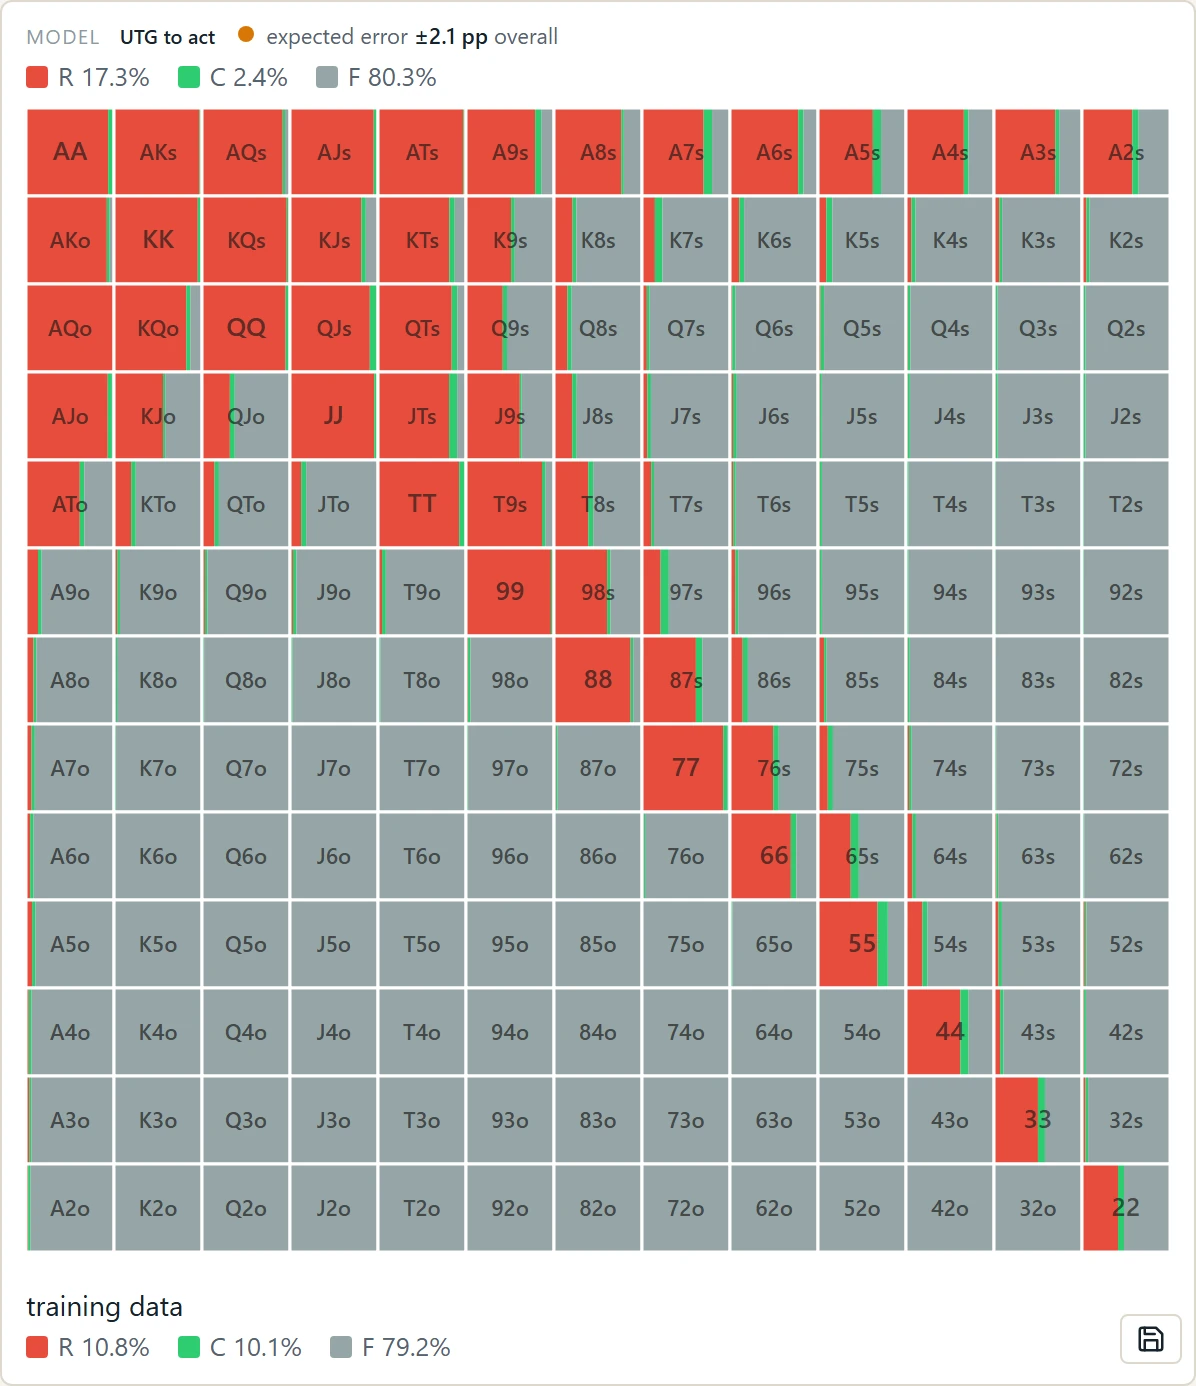
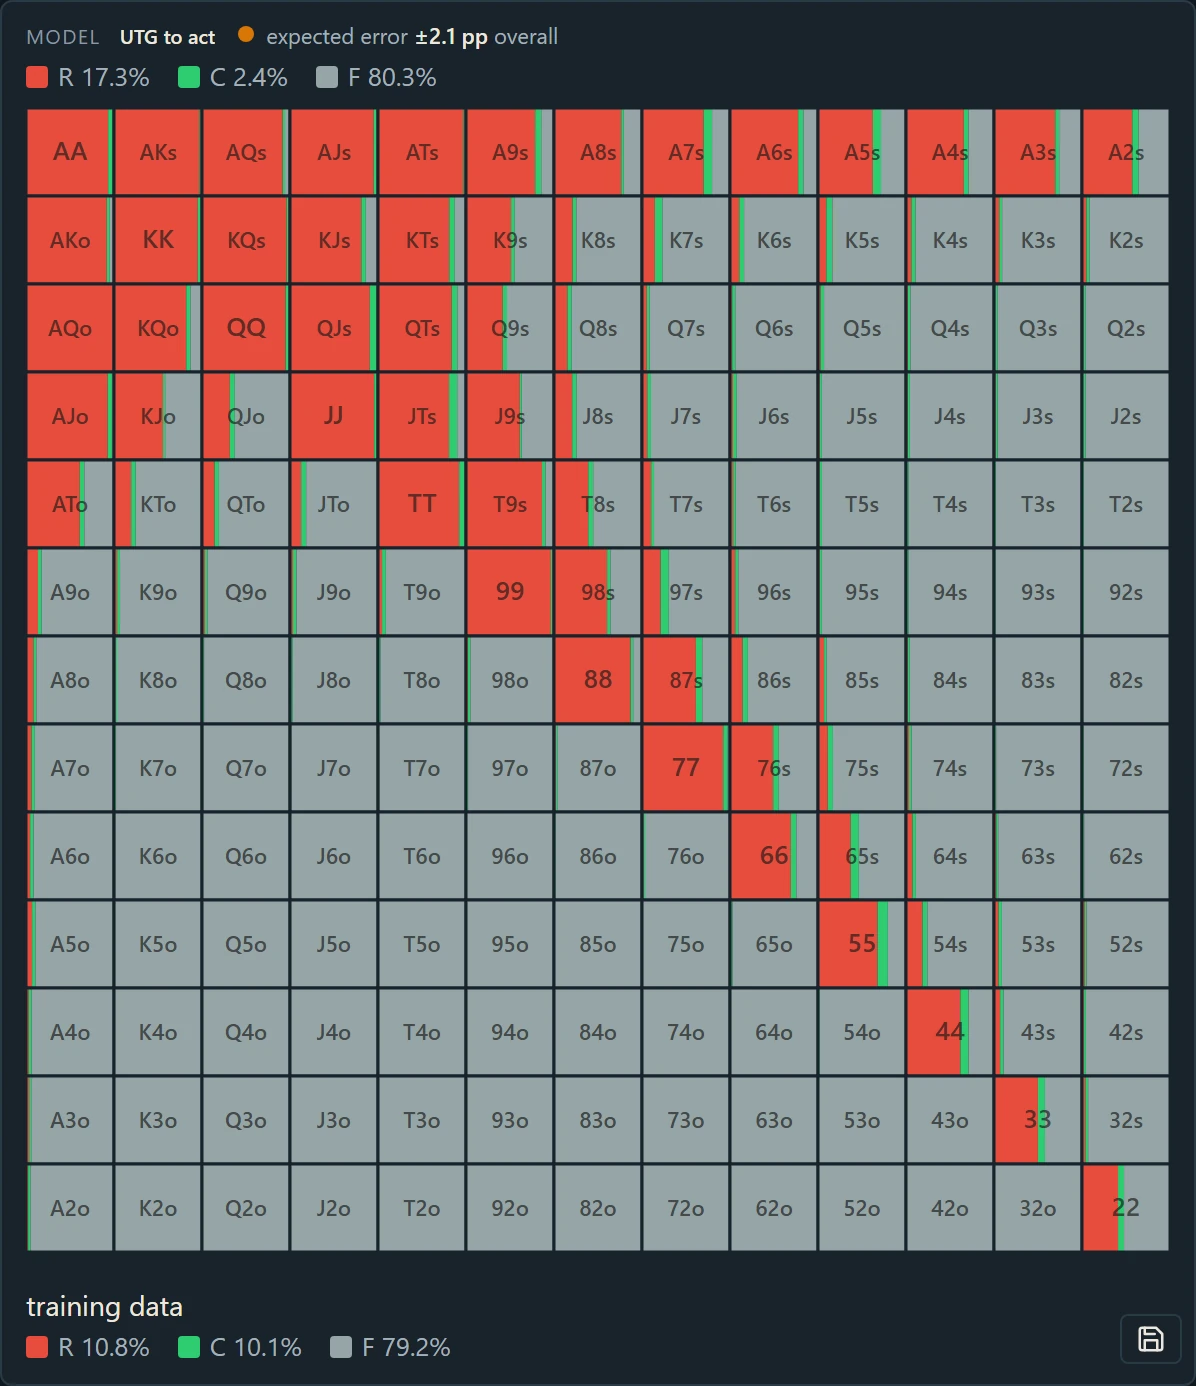
2. Does it predict what players hold?
The model's preflop ranges for the button, with the raw training-data frequencies for the same node in the footer: the model is checked against what the pool actually did, not against a theory.
Now take only the hands that reached showdown, where the real cards are known. Give the model the player's actions along the line, without the cards. It returns a probability for every possible holding. We measure how much probability it gave to the hand that was actually shown.
This is the reconstruction test. A model that only knows how often players bet cannot pass it, because the question is not "how often" but "with what". To score well, the model has to understand which hands take which lines in this pool. Because the test never looks at action frequencies, tuning the model to match frequencies does nothing for it.
3. Does it get the frequencies right?
Across a fixed set of common lines in the game, we compare the model's predicted frequency of each action to the frequency observed in the data. A separate version of the same check groups hands by type on a given board and compares frequencies within each group.
These are guardrails, not goals. Frequencies are easy to match, and a model can match them while being wrong about which hands are doing the betting. So a good frequency score on its own proves little. A bad one, however, means something has gone wrong, which is why the check is kept.
4. Does simulated money match real money?
The most direct test of the model as a whole. Take a strategy that players in the data actually used, for instance, the way the pool as a whole plays a position. Simulate it against the model: deal hands, play them out, and add up the result. Then compare that result to what the same strategy actually earned in the data.
The model will not reproduce the exact number, and it is not expected to. What it must get right is the structure: strategies that earned more in the data must earn more in the simulation, by a comparable margin, in the same direction. When the model is asked to simulate the pool against itself and then a strategy that is known to beat the pool, that strategy should come out ahead, and the gap should look like the gap in the data.
One detail matters here. If you pick the best action by simulated value and then report that same simulated value as the strategy's result, the number is inflated, because among noisy estimates the maximum is usually the one that got lucky. So the strategy is chosen on one simulation and its value is measured on a separate one, with a different random seed.


Direct and indirect
| Measurement | What it asks | Role |
|---|---|---|
| Actions on held-out hands | Did the model expect what players did? | Direct. Primary. |
| Holdings at showdown | Did the model expect what players held? | Direct. |
| Frequencies by line and by hand type | Do the averages match? | Guardrail. |
| Simulated versus observed results | Does the money add up? | Direct, whole-model. |
The distinction is deliberate. The goal of the model is to play like the field by the cards: to know, hand by hand, what this pool does. The first two measurements ask exactly that. Frequencies are a summary of it, one step removed, and a model can get the summary right while missing the thing being summarized. A model that matches the averages can still be wrong about every hand; a model that is right about the hands matches the averages for free. So frequencies are watched, but they are not what the model is optimized for.
How a version gets adopted
Every candidate version is scored on all four measurements against the current one. It replaces the current version only if it improves the primary measurement and is no worse on the others. A candidate that improves frequencies while losing ground on holdings is rejected, and this happens more often than one might expect. Better averages are easy to buy at the cost of worse hands.
The scores themselves are not published here. They move with every version, and a number without its history and its scale tells you little. What does not change is the method: same held-out data, same four questions, adopt only on improvement.
What this does not prove
These tests establish that the model describes the pool it was built from. They do not establish anything about a different pool, a different limit, or a different room. Each model is tested against its own data.
They also test the model of the field, not the exploit computed against it. The exploit is a best response to the model, and where the model is imperfect, the exploit will find and use the imperfection. In some deep spots the exploit itself uses an approximation to finish in reasonable time; the cost of that approximation is measured separately and kept small. But an exploit is only as good as the model beneath it, which is why the model is the thing that gets tested.